Reports
Reports (/reports) is ATracker analytics builder. You assemble a stats cut by dimensions (campaign, geo, device, sub_id, and more), open drilldown levels, compare periods, and export. The Dashboard answers how things are going; Reports answers a concrete question: which sub_id wastes budget, where CR drops by geo, what changed after a landing swap.
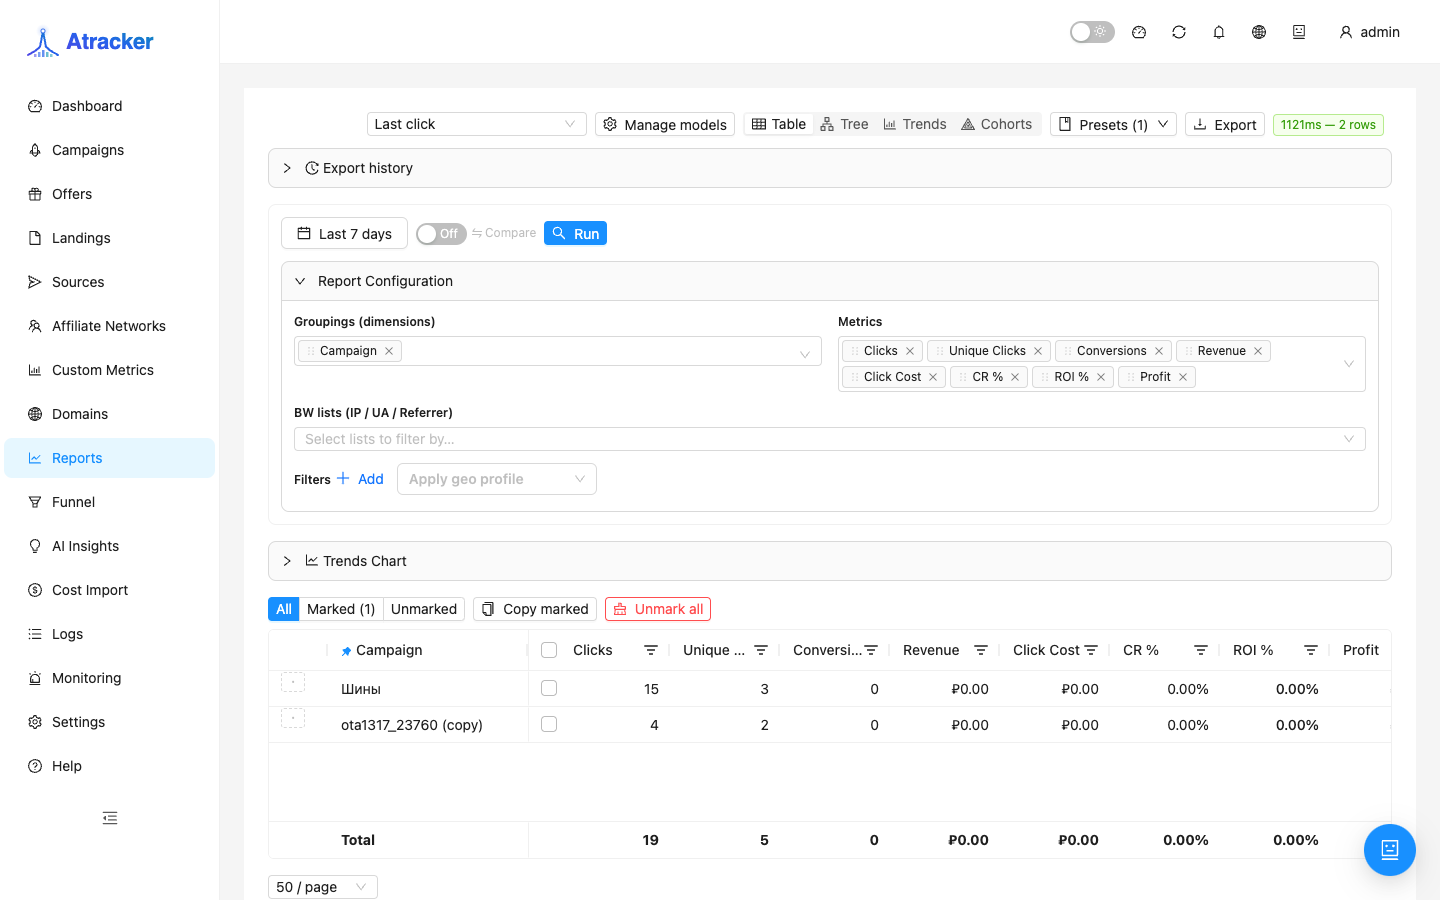
Purpose
After campaigns accept traffic and postbacks write conversions, aggregates appear on the Dashboard. Summary cards do not show cuts. Reports handles operational questions: weekly campaign comparison, country/device breakdown, leaky sub_ids, ROI after Cost Import. Without a correct period, groupings, and filters, the table is empty or too wide to read.
Prerequisites
- Clicks and/or conversions exist for the selected period (an all-zero table usually means no data, not a UI bug).
- Permission for the
reportspage (admin or explicit grant). - For cost / profit / ROI — campaign cost and/or Cost Import rows; otherwise those columns are incomplete.
- Custom metrics already saved at
/new-metricsif you want them in the metric picker.
How to open
- Sidebar → Reports.
- Direct path:
/reports. - If the item is missing, check the user role and page permissions.
Step-by-step workflow
- Period. Pick a preset (Last 7 days, Last 30 days, etc.) or a custom range. It applies to the table and trend chart. On high traffic start with a week — very wide ranges slow the response.
- Groupings (dimensions). Row axes. Typical start: Campaign alone. Then add Country, Device, Sub ID. Available: Campaign, Offer, Landing, Traffic Source, Affiliate Network, Country, Region, City, Device, Browser, OS, ISP, Connection type, Language, Referrer domain, Sub ID 1–30, Date, Day of week, Hour. Grouping order sets drilldown order.
- Metrics. Enable only what you need: clicks, unique clicks, conversions (plus lead/sale/reject when needed), revenue, cost, profit, CR, ROI, EPC, etc. Custom Metrics formulas appear in the same list after you save them.
- Filters. Limit to the campaigns, sources, geos, or campaign statuses you care about so unrelated bundles do not mix.
- Run. Data is not fetched until you run. Empty results after Run — check period/filters first, then Logs.
- Drilldown. Click a row to open the next grouping level (up to 7), e.g. Campaign → Country → Device → Browser. Do not enable every axis at once.
- Trends. Overlay 1–3 metrics on the trend panel to see whether a cost spike matches a CR drop.
- Markers. Mark campaign launch or offer-change dates (also under Settings → Markers) to tie chart spikes to schema changes.
- Period comparison. Compare with the previous equivalent period for absolute and percent deltas — useful for weekly review.
- Preset. Save dimensions + metrics + filters so you do not rebuild the same report every morning.
- Export. CSV for scripts; Excel (XLSX) for spreadsheets; Google Sheets when Settings → Sheets is configured.
Fields in context
Clicks / Unique clicks show volume and uniqueness; a large gap often means bots or repeat hits. Conversions and statuses depend on postbacks and the Conversion Catalog — if a sale is in Logs but missing in the report, check period and account timezone. Revenue comes from conversion payout/revenue. Cost comes from campaign cost models and/or Cost Import. Profit / ROI / CR are derived: ROI without cost is meaningless. Fraud % and Avg Fraud Score help drop dirty bundles before you optimize a landing.
Typical scenarios
- Daily ROI. Grouping: Campaign. Metrics: clicks, cost, revenue, profit, ROI, CR. Filter: active campaigns. Period comparison on. Preset: Daily ROI.
- Budget leak by sub_id. Grouping: Campaign → Sub ID 1 (or your slot). Sort by cost desc; watch CR and ROI. Confirm bad sub_ids in Logs → Clicks.
- Geo optimization. Grouping: Campaign → Country → Device. Countries with clicks and zero CR often mean offer/landing mismatch for that geo.
- After a flow change. Period around the change + a chart marker; compare CR and EPC before/after.
Permissions and performance
A user with limited report columns (RBAC) may not see some metrics — that is a permission limit, not missing stats. Large periods with many groupings are slower: narrow period or filters, then drill down. A preset does not freeze data — each Run recomputes against current data. Google Sheets export needs the Sheets integration; CSV/Excel work without it.
Weekly review workflow
- Open the Daily ROI / weekly preset for Last 7 days with period comparison.
- Flag campaigns with ROI drops or cost growth — drill into Country / Sub ID.
- Confirm suspicious sub_ids in Logs → Clicks; missing sales in Postbacks.
- If cost looks fine but the ads cabinet disagrees — reconcile Cost Import → Daily Costs for the same dates.
- Save/update markers for offer/flow change dates so next week trends stay readable.
Common mistakes
- Reading ROI without Cost Import and without campaign cost — profit looks fine but is false.
- Enabling 5+ groupings at once — unreadable; drill step by step.
- Mixing account timezone with the traffic source clock — an empty day is often a day-boundary shift.
- Expecting a custom metric in Reports before saving it at
/new-metrics. - Filtering campaigns mentally without UI filters — unrelated sources mix in one table.
Related: Funnel (where the path drops), Cost Import (spend), Custom Metrics (formulas), Logs (single-event checks).