Dashboard
The Dashboard is the operator home screen for “over the period” and “right now” control. Use it to see whether traffic is alive, whether conversions and ROI dropped, and whether quality looks off on the Fraud tab. It is not a replacement for Advanced Report: there are no arbitrary groupings or drilldown here — for geo/device/sub_id slices open /reports.
Purpose. Quickly answer: how many clicks and conversions in the selected period, what live flow is happening now, which campaigns/offers lead the volume, and whether traffic looks dirty on the Fraud tab.
Prerequisites
You need Dashboard page access. For meaningful cost, profit, and ROI, campaigns need a cost model and/or Cost Import (/cost-import). Without spend data, Cost/ROI cards often show zero — that is missing spend data, not a broken Dashboard.
How to open
- Sidebar → Dashboard, or admin root
/. - Pick a period (Today / Yesterday / Last 7 days / Last 30 days / This month, or Custom).
- Optionally narrow with the campaign filter — otherwise totals cover every campaign you can access.
How to read the screen (step by step)
- Metric cards (Clicks, Conversions, Revenue, Cost and related derivatives). Values apply to the selected period. The card sparkline is a short recent trend (~30 minutes), not the whole period. Read the card number first, then the line shape.
- Live / Recent Activity. Active Visitors — unique visitors in the last 5 minutes. Next to it — clicks per hour and conversions per hour for the current hour. This is not “clicks per minute”: compare live to an hourly pace, not a per-minute counter.
- Below live you usually see top campaigns/offers and mini charts — useful to see what carries volume without opening a full report.
- Historical chart for the period: clicks, conversions, revenue, cost, profit, CR, EPC, CPL, CPS, ROI. Toggle series in the legend. For “what happened yesterday”, trust the chart and cards, not live alone.
- If Custom Metrics (
/new-metrics) are enabled and added to the Dashboard config, extra cards appear beside the built-ins.
Fraud tab on the Dashboard
There is no separate Fraud Dashboard page in the menu. The Dashboard has a Fraud tab with a quality summary for the selected scope/period. Thresholds, weights, and related policies live under Settings → Fraud Score — the Fraud tab shows the picture; Settings defines the rules.
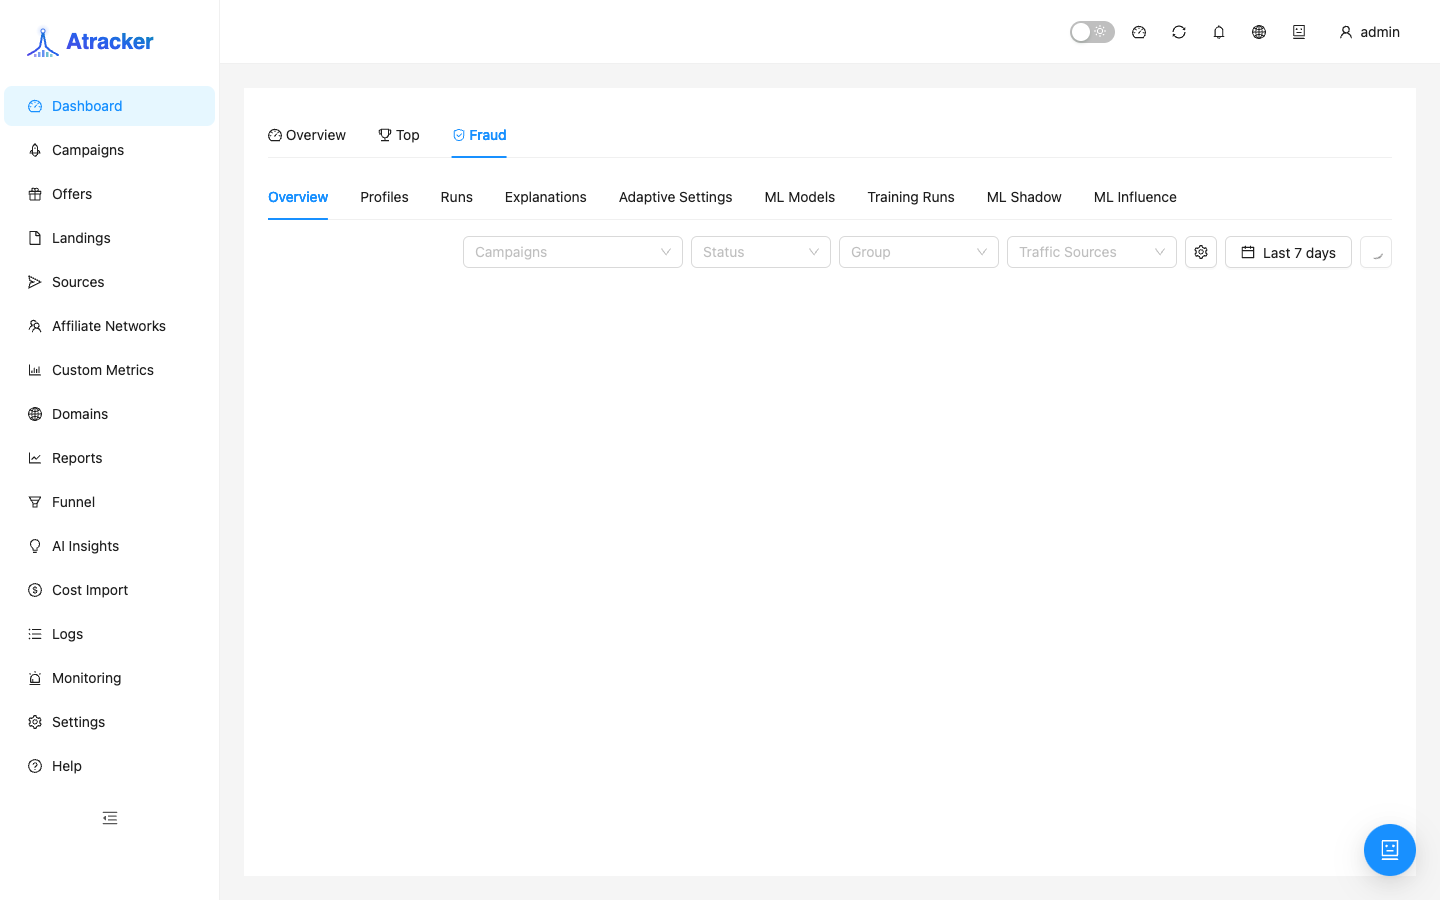
Operator order for quality checks: Dashboard → Fraud first (is there a spike), then Settings → Fraud Score (is the threshold too aggressive / is legitimate traffic blocked), then Logs for a specific campaign.
Typical scenarios
Morning check. Period = Today → cards and live → if clicks exist but conversions do not, go to Logs, not Reports. If ROI looks red, check Cost Import and offer payouts.
Compare two campaigns. Select them in the Dashboard campaign filter; for sub_id/geo detail open Reports with groupings.
Live is quiet but yesterday was fine. Check System status in the header, campaign status (paused), domain DNS/SSL, and that ads still hit the current campaign URL. Live reflects recent activity; empty live with non-zero daily cards is normal in quiet hours.
Reading Cost, Profit, and ROI without fooling yourself
The Revenue card grows from conversions with payout. Cost grows from the campaign cost model and/or spend import. Profit and ROI are derivatives: if Cost is empty, a “great” ROI may only mean “spend unknown”. After changing a cost model or running Cost Import, refresh the Dashboard period and make sure the campaign filter is not excluding the entities you just imported.
Compare Today vs Yesterday on the same campaign set. If Today looks weak only on live while daily cards are still accumulating, do not pause everything yet — open Logs for the top campaign from the live block first.
Dashboard → next screens
Dashboard answers “what is happening”. Next:
- Need a sub_id / geo / device slice — Reports.
- Need a raw click or postback row — Logs.
- Need to fix URL, flow, or pixel — Campaigns.
- Need to tighten/loosen quality — Settings → Fraud Score after the Fraud tab.
Do not rotate creatives from a card sparkline alone: that needs Reports groupings and sub_id tagging from Traffic Source.
What to check if the Dashboard “looks wrong”
- Wrong period or campaign filter — reset Custom and clear the filter.
- Cost/ROI = 0 with live conversions — no spend import / campaign cost; the Dashboard computes from available data.
- Live = 0 after a test click — wait for the widget refresh; the click should appear in Logs. Live counts 5-minute visitors and hourly pace, not an instant tick.
- Empty charts with live logs — check System status (ClickHouse and related services).
- Fraud tab looks “red” while ads look fine — recheck the Fraud Score threshold and campaign scope; do not expect a separate Fraud menu page (there is none).